Bitcoin price is facing resistance near $17,000. BTC could start another decline unless there is a strong move above the $17,000 resistance zone.
- Bitcoin recovered higher above the $16,800 resistance zone.
- The price is trading above $16,800 and the 100 hourly simple moving average.
- There is a rising channel forming with resistance near $17,000 on the hourly chart of the BTC/USD pair (data feed from Kraken).
- The pair could resume its decline unless there is a close above the $17,000 resistance zone.
Bitcoin Price Faces Resistance
Bitcoin price found support near the $16,250 zone. BTC traded as low as $16,260 and started a recovery wave. There was a clear move above the $16,500 and $16,600 levels.
The bulls were able to push the price above the $16,800 resistance and the 100 hourly simple moving average. The price even spiked above the $17,000 resistance, but upsides were limited. A high was formed near $17,067 and the price is now trading in a range.
Bitcoin price declined below the 23.6% Fib retracement level of the upward move from the $16,260 swing low to $17,067 high. It is now trading above $16,800 and the 100 hourly simple moving average.
There is also a rising channel forming with resistance near $17,000 on the hourly chart of the BTC/USD pair. On the upside, an immediate resistance is near the $17,000 zone. The first major resistance is near the $17,200 zone. A clear move above the $17,200 resistance might call for a move towards the $17,500 resistance.
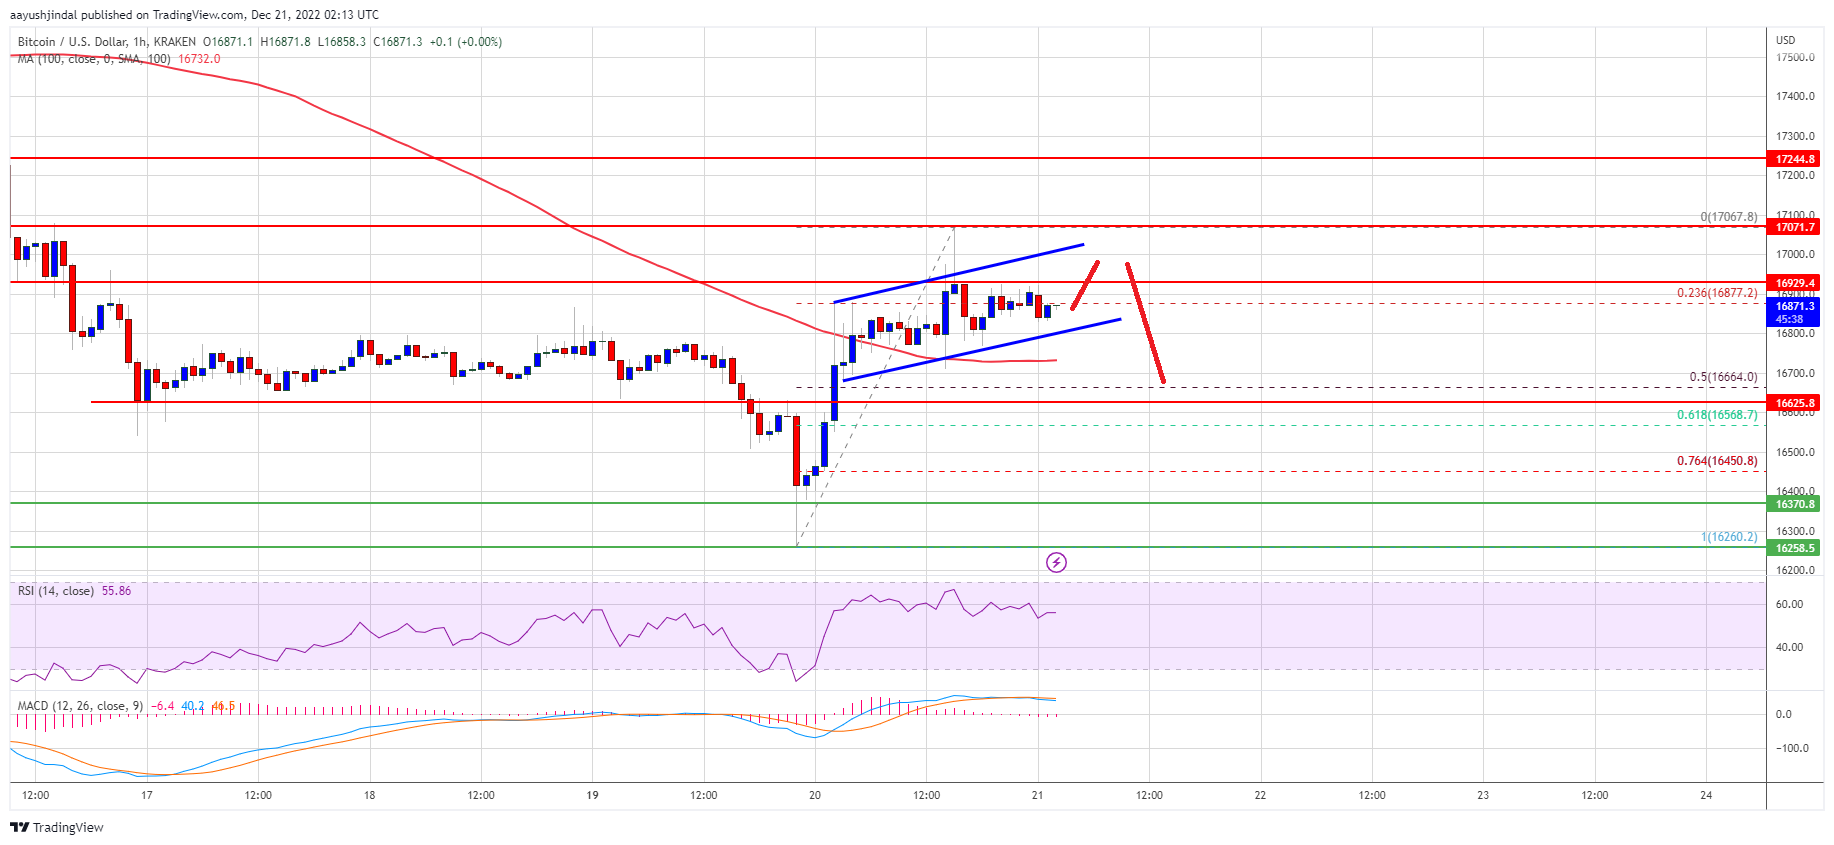
Source: BTCUSD on TradingView.com
The next major resistance is near $18,000, above which the price might gain pace and rise towards the $18,450 resistance zone in the coming sessions.
Fresh Decline in BTC?
If bitcoin fails to clear the $17,000 resistance, there could be a fresh decline. An immediate support on the downside is near the $16,800 level and the channel trend line.
The next major support is near the $16,650 zone. It is close to the 50% Fib retracement level of the upward move from the $16,260 swing low to $17,067 high. A downside break below the $16,650 support might call for a drop towards the $16,260 level. Any more losses might send the price towards $16,000.
Technical indicators:
Hourly MACD – The MACD is now losing pace in the bullish zone.
Hourly RSI (Relative Strength Index) – The RSI for BTC/USD is now above the 50 level.
Major Support Levels – $16,800, followed by $16,650.
Major Resistance Levels – $17,000, $17,200 and $17,500.