


Bitcoin price is consolidating losses below the $26,500 level. BTC is showing bearish signs and remains at risk of a fresh decline toward $25,000.
- Bitcoin is struggling to recover above the $26,600 resistance zone.
- The price is trading below $26,500 and the 100 hourly Simple moving average.
- There is a short-term bullish trend line forming with support near $26,050 on the hourly chart of the BTC/USD pair (data feed from Kraken).
- The pair could continue to move down and trade below the $26,000 support.
Bitcoin Price Turns Red
Bitcoin price started a recovery wave from the $24,800 support zone. BTC managed to recover above the $25,000 and $25,500 resistance levels.
There was a move above the 23.6% Fib retracement level of the downward move from the $29,180 swing high to the $24,800 low. However, the price is facing a lot of hurdles on the upside near $26,600. It is still trading below $26,500 and the 100 hourly Simple moving average.
Besides, there is a short-term bullish trend line forming with support near $26,050 on the hourly chart of the BTC/USD pair. If Bitcoin stays above the trend line, it could attempt a recovery wave.
Immediate resistance is near the $26,400 level. The next major resistance is near $26,500 and the 100 hourly Simple moving average. A clear move above the 100 hourly Simple moving average could start a recovery wave toward the $27,000 resistance.
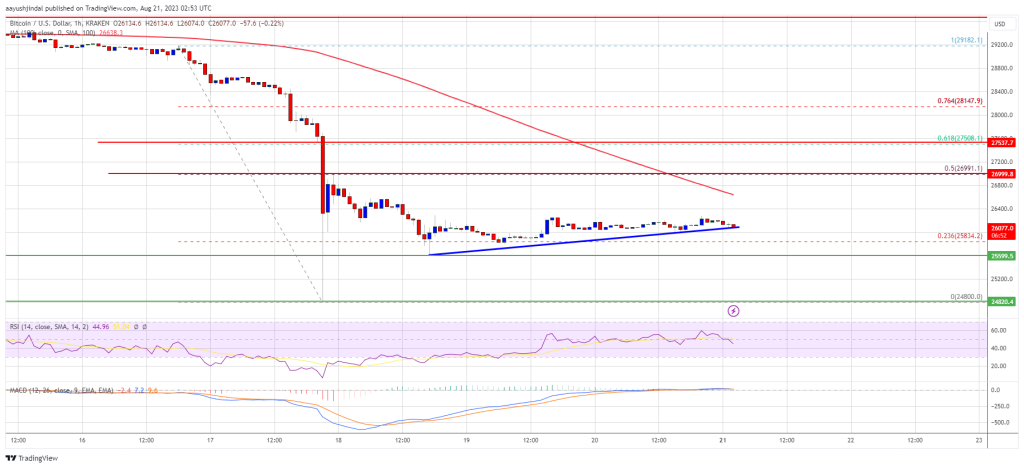
Source: BTCUSD on TradingView.com
The 50% Fib retracement level of the downward move from the $29,180 swing high to the $24,800 low is near $27,000 to act as a resistance. A close above the $27,000 resistance could start a decent increase toward the $27,500 resistance zone. Any more gains might set the pace for a larger increase toward $28,150.
Another Decline In BTC?
If Bitcoin fails to clear the $26,500 resistance, it could continue to move down. Immediate support on the downside is near the $26,000 zone and the trend line.
The next major support is near the $25,600 level. A downside break below the $25,600 level might push the price further into a bearish zone. In the stated case, the price could drop toward $25,000.
Technical indicators:
Hourly MACD – The MACD is now gaining pace in the bearish zone.
Hourly RSI (Relative Strength Index) – The RSI for BTC/USD is now below the 50 level.
Major Support Levels – $26,000, followed by $25,600.
Major Resistance Levels – $26,500, $27,000, and $27,500.