
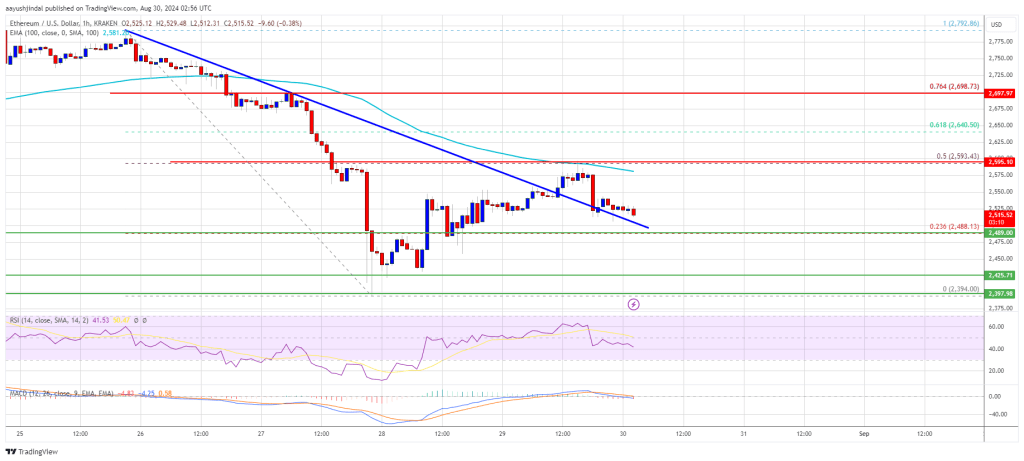
Ethereum price started a recovery wave from the $2,400 zone. ETH is now struggling to gain pace for a move above the $2,600 resistance zone.
- Ethereum started a recovery wave above $2,500 and $2,550.
- The price is trading below $2,550 and the 100-hourly Simple Moving Average.
- There was a break above a key bearish trend line with resistance at $2,550 on the hourly chart of ETH/USD (data feed via Kraken).
- The pair must stay above $2,485 to start another increase in the near term.
Ethereum Price Attempts Recovery
Ethereum price remained stable above $2,400 and attempted a recovery wave like Bitcoin. The price was able to rise above the $2,480 and $2,500 resistance levels.
There was a move above the 23.6% Fib retracement level of the downward wave from the $2,792 swing high to the $2,395 low. The price even surpassed the $2,550 resistance. There was a break above a key bearish trend line with resistance at $2,550 on the hourly chart of ETH/USD.
However, the bears were active near the $2,600 resistance. They protected the 50% Fib retracement level of the downward wave from the $2,792 swing high to the $2,395 low.
Ethereum price is now trading below $2,580 and the 100-hourly Simple Moving Average. On the upside, the price seems to be facing hurdles near the $2,550 level and the 100-hourly Simple Moving Average. The first major resistance is near the $2,600 level. A close above the $2,600 level might send Ether toward the $2,660 resistance.
The next key resistance is near $2,720. An upside break above the $2,720 resistance might send the price higher toward the $2,820 resistance zone in the near term.
Another Decline In ETH?
If Ethereum fails to clear the $2,600 resistance, it could start another decline. Initial support on the downside is near $2,500. The first major support sits near the $2,485 zone.
A clear move below the $2,485 support might push the price toward $2,420 where the bulls could emerge. Any more losses might send the price toward the $2,320 support level in the near term. The next key support sits at $2,250.
Technical Indicators
Hourly MACD – The MACD for ETH/USD is losing momentum in the bullish zone.
Hourly RSI – The RSI for ETH/USD is now below the 50 zone.
Major Support Level – $2,485
Major Resistance Level – $2,600