On-chain data shows the divergence between the Bitcoin long-term holders and short-term holders has grown to record levels recently.
Bitcoin Market Has Been Continuing Its Shift Towards HODLing
As an analyst in a post on X explained, the gap between the speculators and HODLers in the market has only grown wider recently. The “short-term holders” (STHs) and the “long-term holders” (LTHs) are the two primary cohorts that the entire Bitcoin market can be divided into.
The STHs refer to all those investors who purchased their coins less than 155 days ago, while the LTHs include the holders who have been holding onto their tokens beyond that period.
Statistically, the longer an investor keeps their coins dormant, the less likely they become to sell them at any point. Due to this reason, the STHs are usually the group with the weaker conviction of the two.
The LTHs often hold through volatile periods in the asset without moving an inch, which has earned them the popular name “diamond hands.” The STHs, on the other hand, tend to sell quickly whenever FUD emerges in the sector, or a profitable selling opportunity appears.
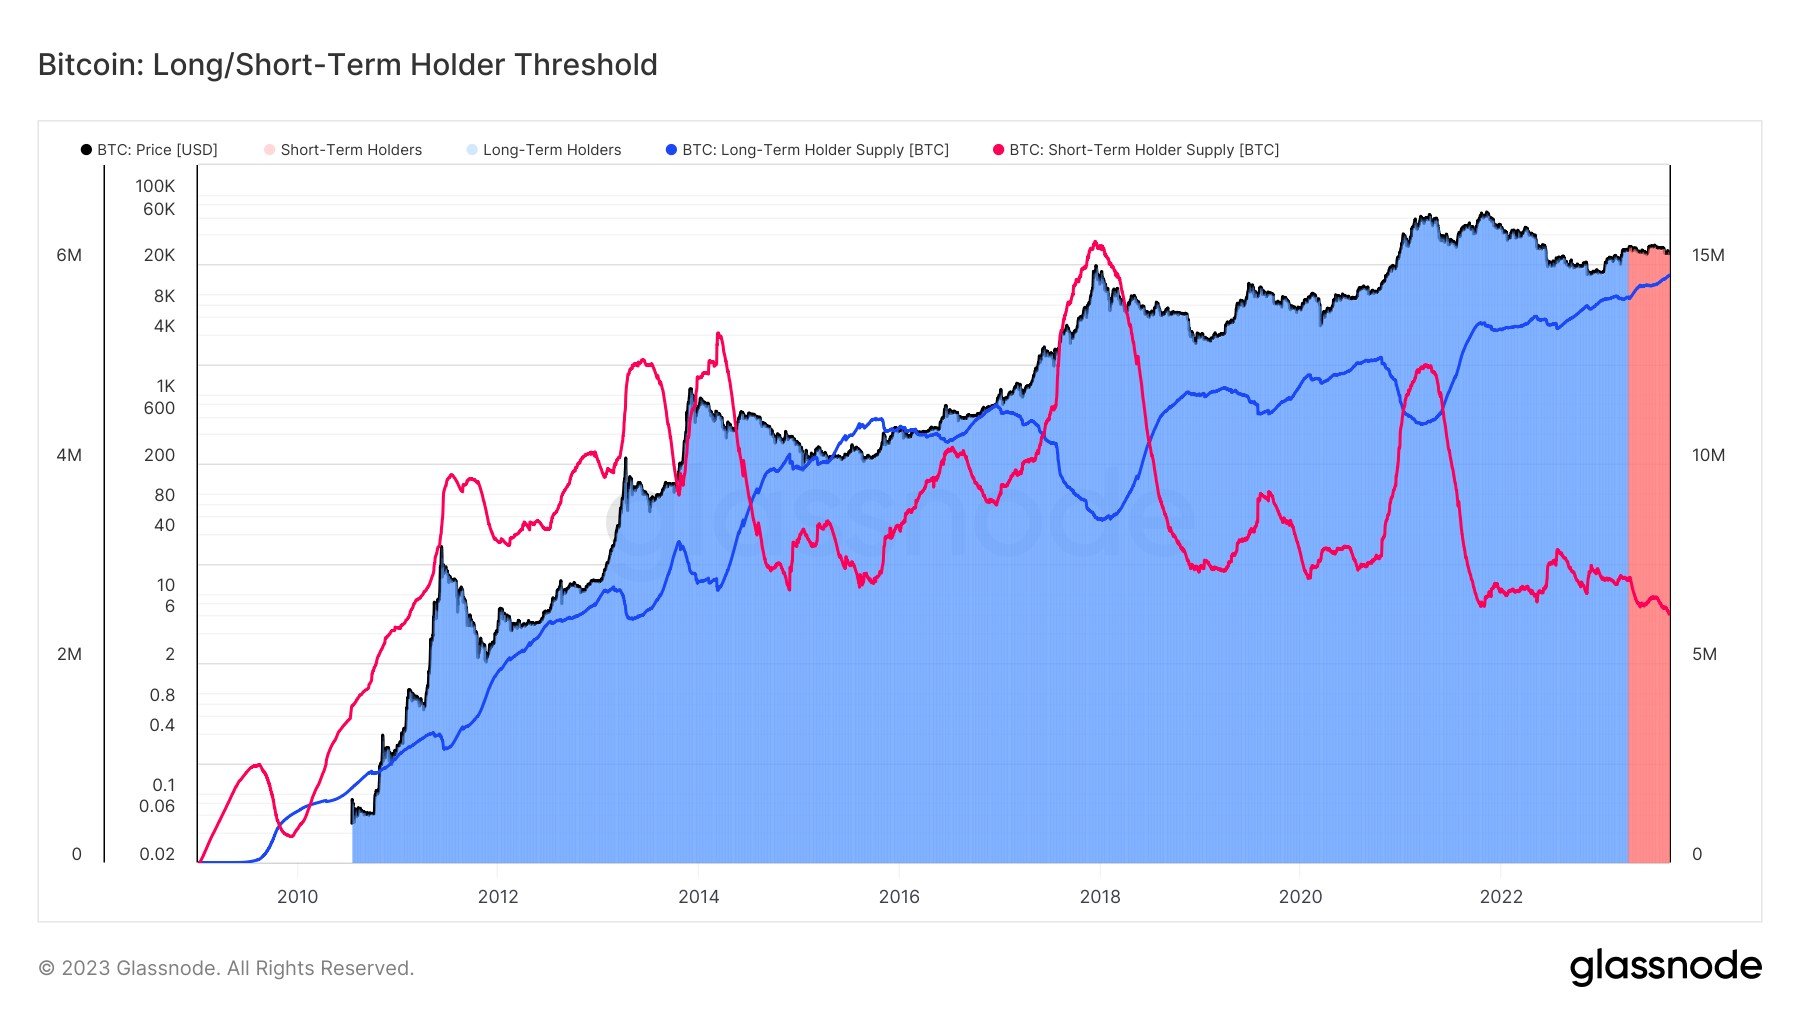
Now, here is a chart that shows the trend in the supplies of these BTC investor groups throughout the history of the cryptocurrency:
The graph shows that the Bitcoin LTH supply has been on an uptrend during the past couple of years, while the STH supply has been going down recently. This would suggest that the overall supply of the cryptocurrency is continuously becoming more dormant.
The gap between these groups is the widest it has ever been, as the LTH supply is nearing the 15 million BTC mark, while the STH supply has dropped under the 2.5 million BTC level.
The latter’s latest value is the lowest it has ever been since 2011 when the asset was still in its infancy. It would appear that short-term speculators in the market have thinned to record lows.
Last month, Bitcoin witnessed a sharp crash from above the $29,000 level to below the $26,000 mark, and the asset has not recovered. As is apparent from the chart, though, the LTHs haven’t cared about the asset’s struggle at all, as their supply has only continued to head up while the STHs have shrunken down further.
The LTH group remaining strong and continuing its growth may not affect the market in the short-term, but during longer periods, the supply continuing to become locked in the wallets of these HODLers could have a bullish impact due to how supply-demand dynamics work.
BTC Price
At the time of writing, Bitcoin is floating around the $25,700 mark, registering a dip of 6% over the past week.


