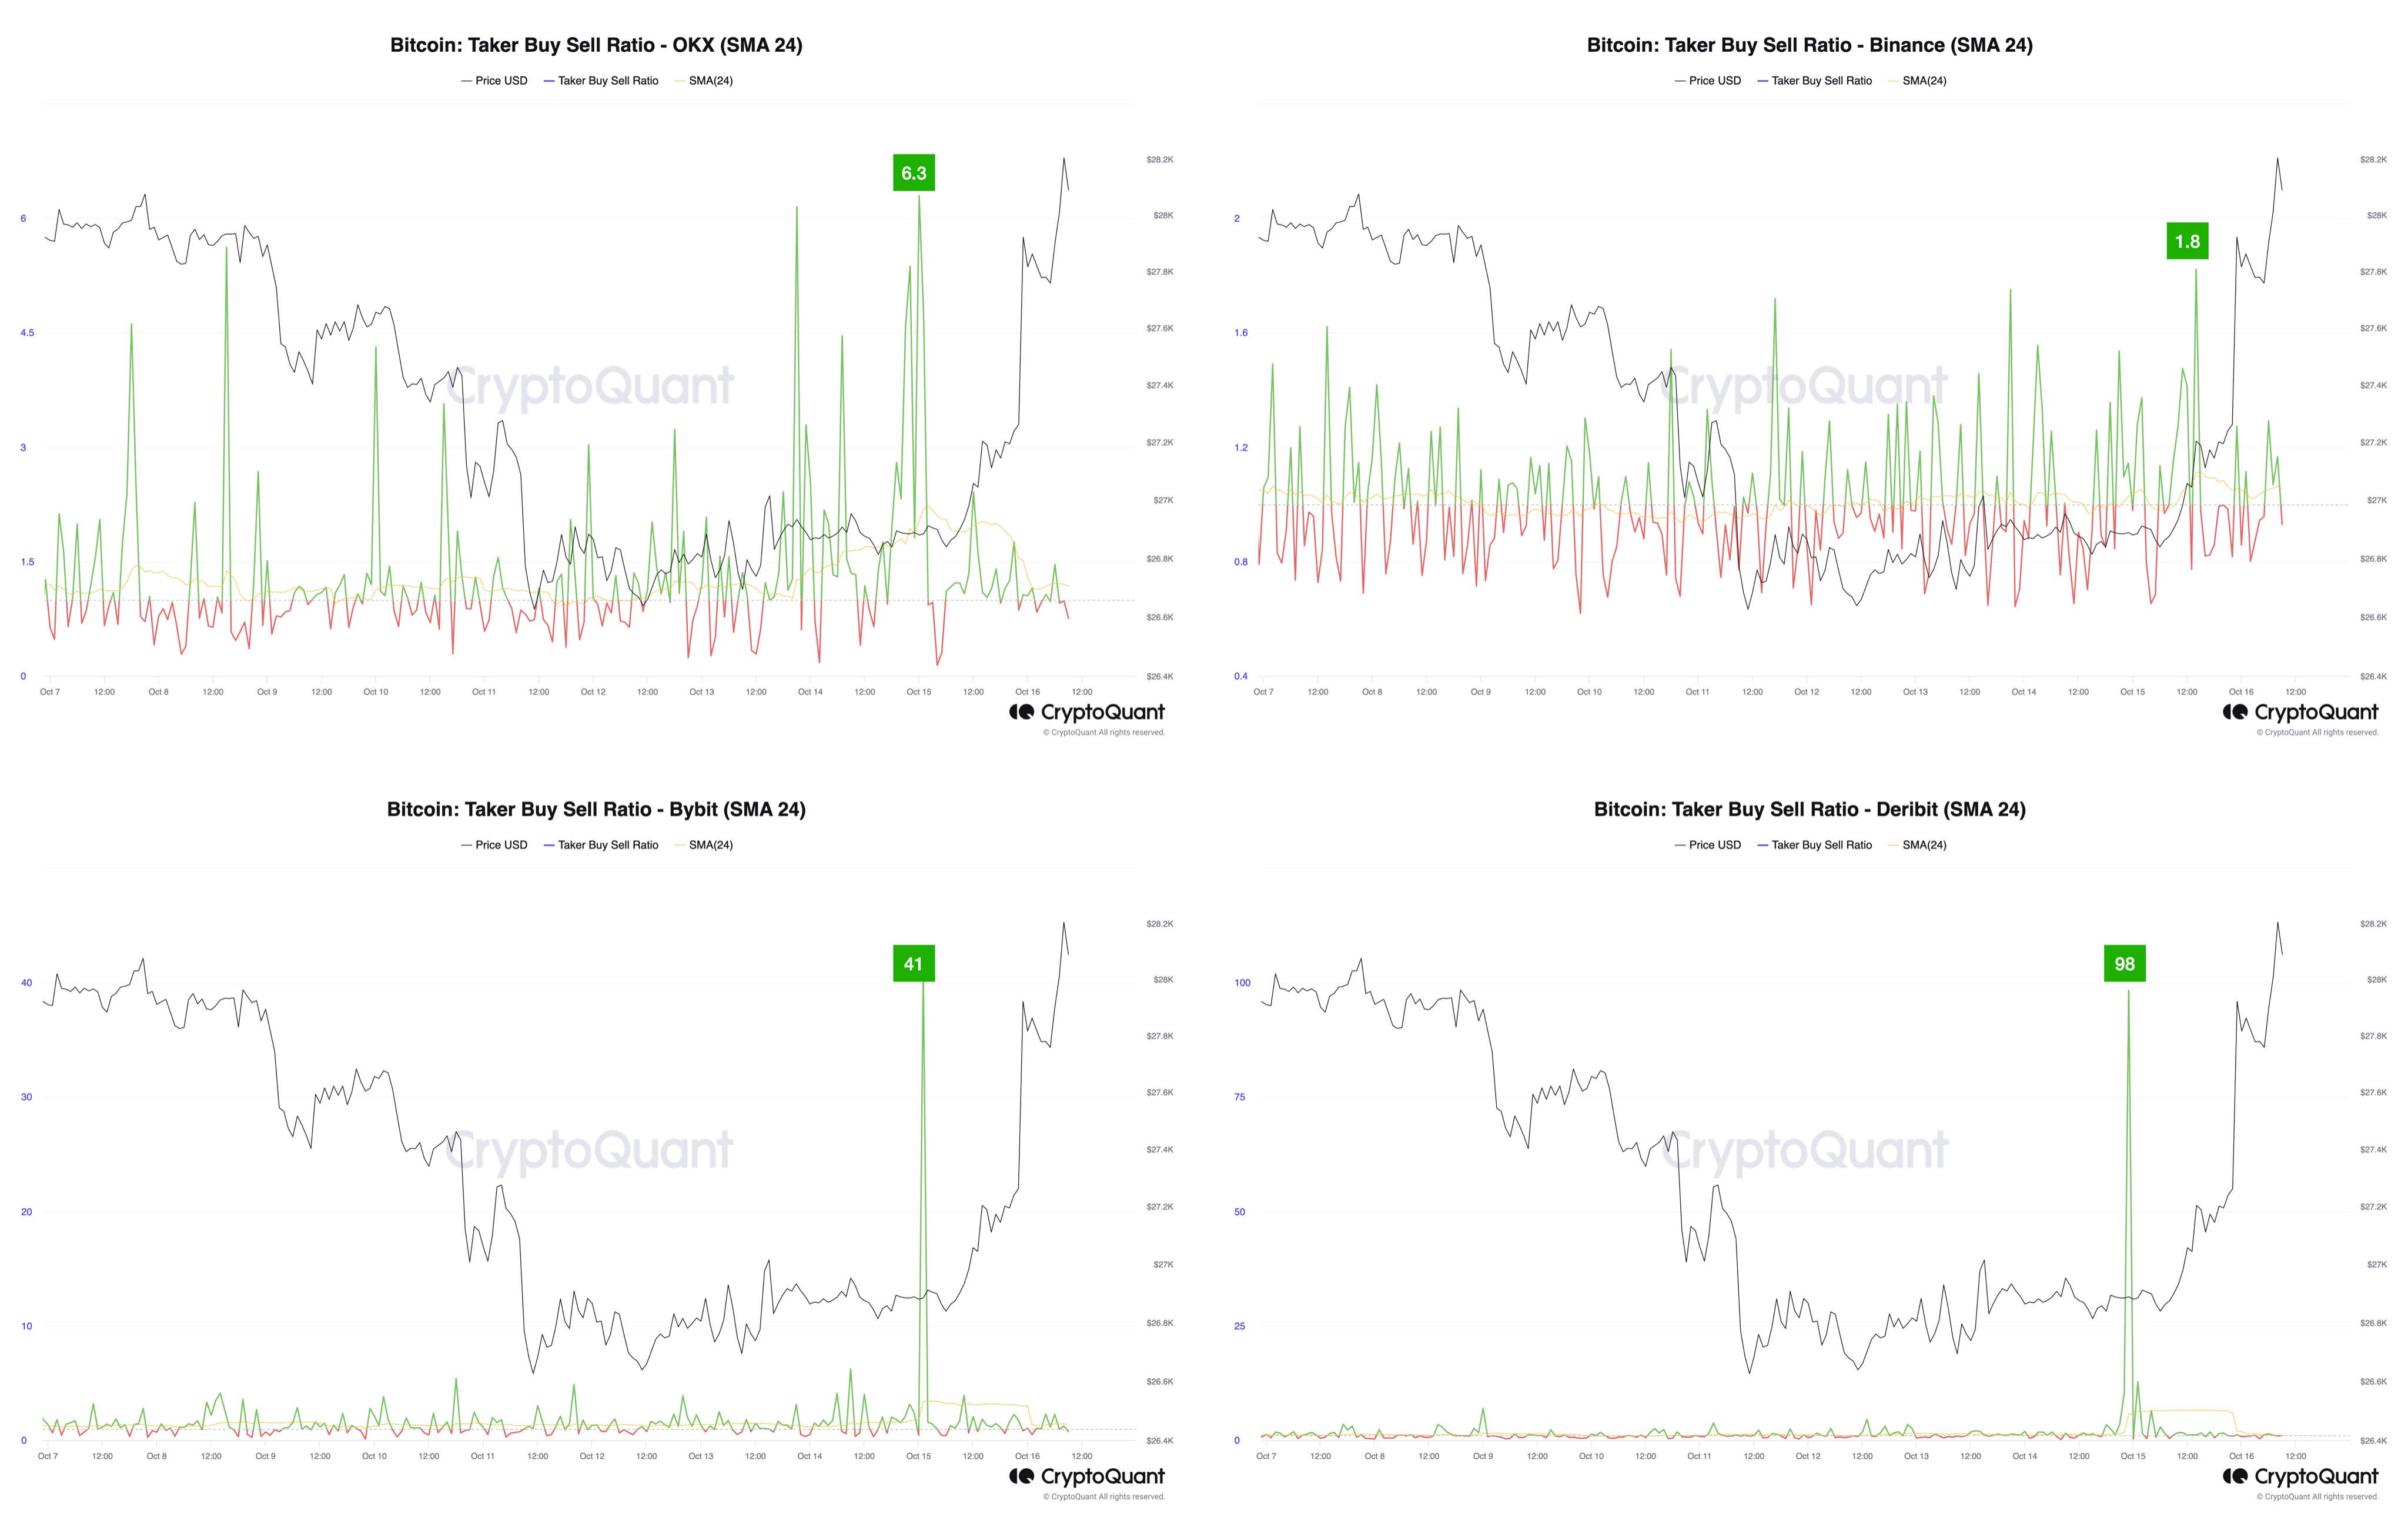
An analyst has pointed out how some suspicious Bitcoin buying activity took place on Bybit and Deribit in the leadup to yesterday’s flash surge.
Bitcoin Taker Buy Sell Ratio Saw Extraordinary Spikes On Bybit & Deribit Yesterday
In a new post on X, Julio Moreno, head of research at CryptoQuant, discussed how the BTC taker buy-sell ratio looked like for the different exchanges in the market leading up to the surprise rally yesterday.
The “taker buy sell ratio” here refers to an indicator that keeps track of the ratio between the taker buy and taker sell volumes for Bitcoin on any given exchange (or group of platforms).
When the value of this metric is greater than 1, it means that the taker buy volume is more than the sell volume currently. Such a trend suggests that the investors are willing to pay more to purchase the asset and thus, a bullish sentiment is shared by the majority.
On the other hand, a value under the threshold implies a bearish mentality is active on the exchange as the traders are willing to sell the asset at a lower price at the moment.
Now, here is a chart that shows the trend in the 24-day simple moving average (SMA) Bitcoin taker buy-sell ratio over the past few days for four exchanges: Binance, OKX, Bybit, and Deribit.
Yesterday, Bitcoin saw a very sharp sudden rally as false news broke out that the iShares BTC spot ETF had been approved by the US SEC. This surge, however, retraced in as spectacular a fashion as it had occurred as the market quickly realized that the rumor was without any substance.
From the chart, it’s visible that all four of these exchanges saw spikes in the taker buy-sell ratio in the hours leading up to this rally. The spikes on Binance and OKX, though, were of pretty normal levels, as spikes of similar scales had occurred in the preceding days as well.
In the case of Bybit and Deribit, however, the 24-day SMA of the ratio had hit peaks of 41 and 98, respectively, which are both extremely high levels. For comparison, the indicator only hit 1.8 on Binance and 6.3 on OKX.
This would suggest that some really high Bitcoin buying volume was observed on Bybit and Deribit, which was unlike what was seen on other exchanges in the sector.
It’s unclear what this pattern means, but it’s possible that some users on these platforms had already been tipped on the fake announcement in advance.
BTC Price
Regardless of the quick rally and crash, Bitcoin has enjoyed some upward momentum during the past couple of days as the cryptocurrency’s value has now climbed toward the $28,500 level.


