
Ripple remained well bid above the $0.35 support against the US Dollar. XRP price seems to be eyeing a fresh rally towards the $0.45 level.
- Ripple started a decent increase from the $0.32 support zone against the US dollar.
- The price is now trading above $0.350 and the 100 simple moving average (4-hours).
- There was a break above a major bearish trend line with resistance near $0.374 on the 4-hours chart of the XRP/USD pair (data source from Kraken).
- The pair could start a strong increase if it clears the $0.400 resistance zone.
Ripple Price Eyes Fresh Increase
After a strong decline, ripple’s XRP formed a base above the $0.320 zone against the US Dollar. The price started a decent increase above the $0.335 and $0.340 resistance levels.
The bulls pushed the price above the 23.6% Fib retracement level of the downward move from the $0.5099 swing high to $0.3200 swing low. Besides, there was a break above a major bearish trend line with resistance near $0.374 on the 4-hours chart of the XRP/USD pair.
XRP is rising steadily above the 100 simple moving average (4-hours) and outperforming both bitcoin and ethereum. The price is now facing hurdles near $0.395 and $0.400. The first major resistance is near the $0.415 level.
The 50% Fib retracement level of the downward move from the $0.5099 swing high to $0.3200 swing low is also near the $0.415 level. A successful break above the $0.415 resistance might send the price towards the $0.450 resistance.
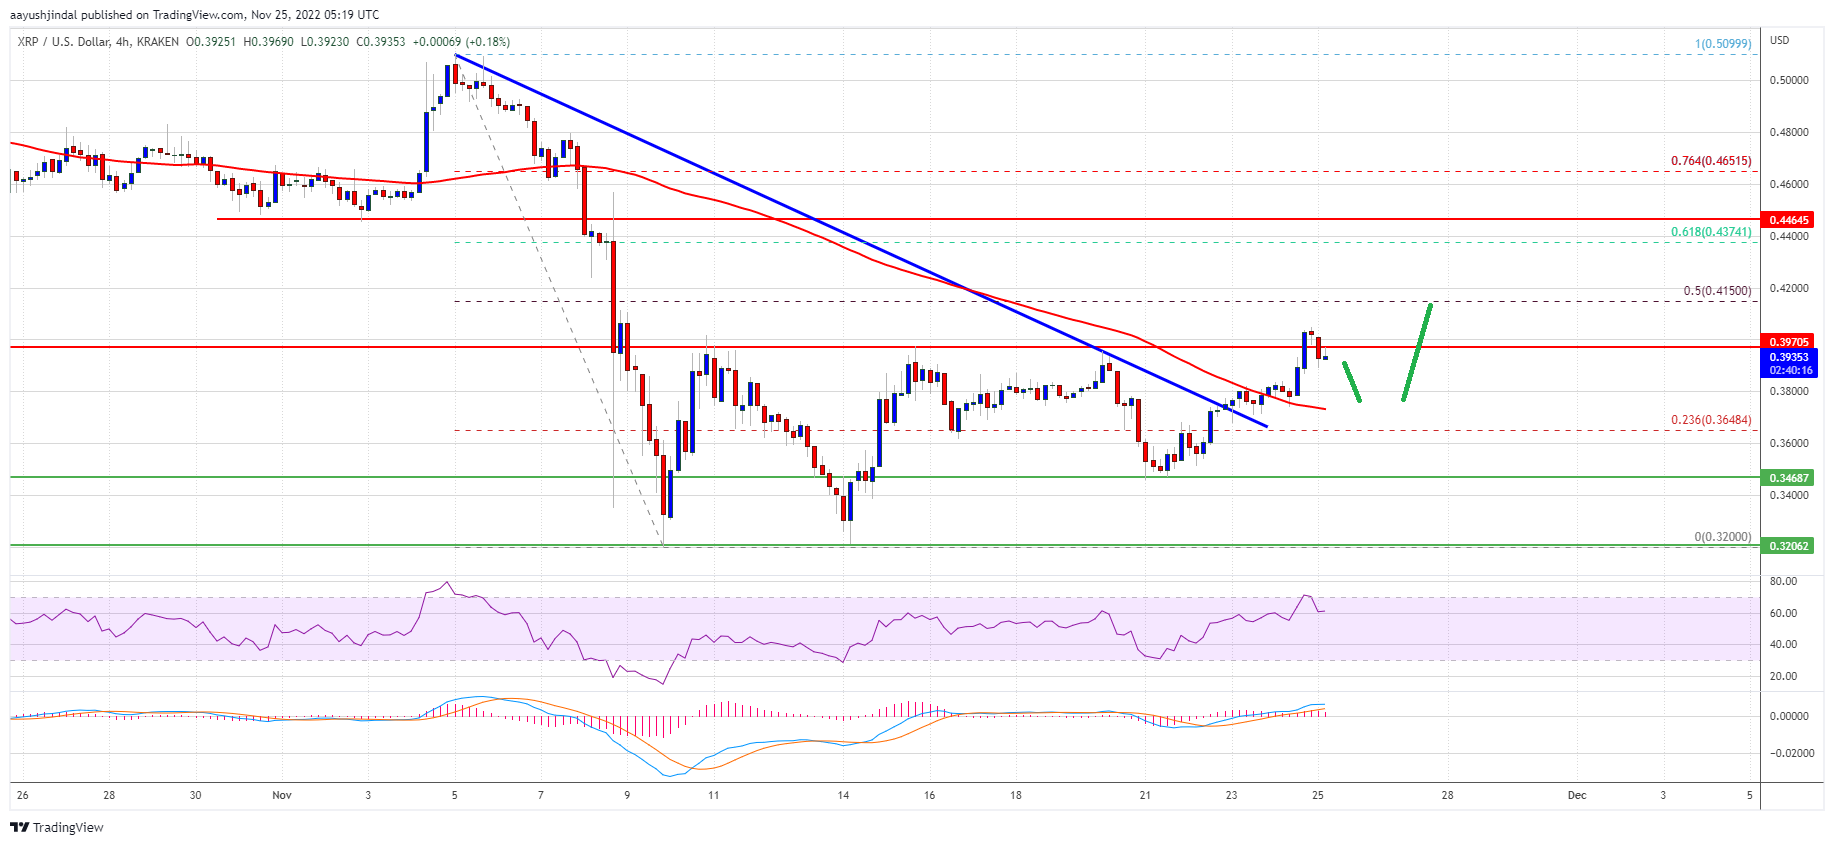
Source: XRPUSD on TradingView.com
The next key resistance is near the $0.465 level. Any more gains might send the price towards the $0.50 level in the coming days.
Dips Supported in XRP?
If ripple fails to clear the $0.415 resistance zone, it could slowly move down. An initial support on the downside is near the $0.380 level and the 100 simple moving average (4-hours).
The next major support is near $0.345. If there is a downside break and close below the $0.345 level, xrp price could extend losses. In the stated case, the price could even decline below the $0.320 support.
Technical Indicators
4-Hours MACD – The MACD for XRP/USD is now losing pace in the bullish zone.
4-Hours RSI (Relative Strength Index) – The RSI for XRP/USD is now above the 50 level.
Major Support Levels – $0.380, $0.345 and $0.320.
Major Resistance Levels – $0.400, $0.415 and $0.450.