
Ethereum started a major recovery wave from $1,500 against the US Dollar. ETH rallied nearly 10% and might aim a move towards the $1,700 resistance.
- Ethereum started a major increase after the bulls appeared near the $1,500 zone.
- The price is now trading above $1,600 and the 100 hourly simple moving average.
- There is a key bearish trend line forming with resistance near $1,650 on the hourly chart of ETH/USD (data feed via Kraken).
- The pair must clear $1,650 to continue higher towards $1,700 in the near term.
Ethereum Price Aims Higher
Ethereum saw a major decline below the $1,600 support similar to bitcoin. ETH even dived below $1,550 before the bulls took a stand.
It seems like the bulls defended the $1,500 support. A low was formed near $1,490 and the price started a major increase. There was a clear move above the $1,550 and $1,580 resistance levels. Ether even cleared the 50% Fib retracement level of the key drop from the $1,685 swing high to $1,490 low.
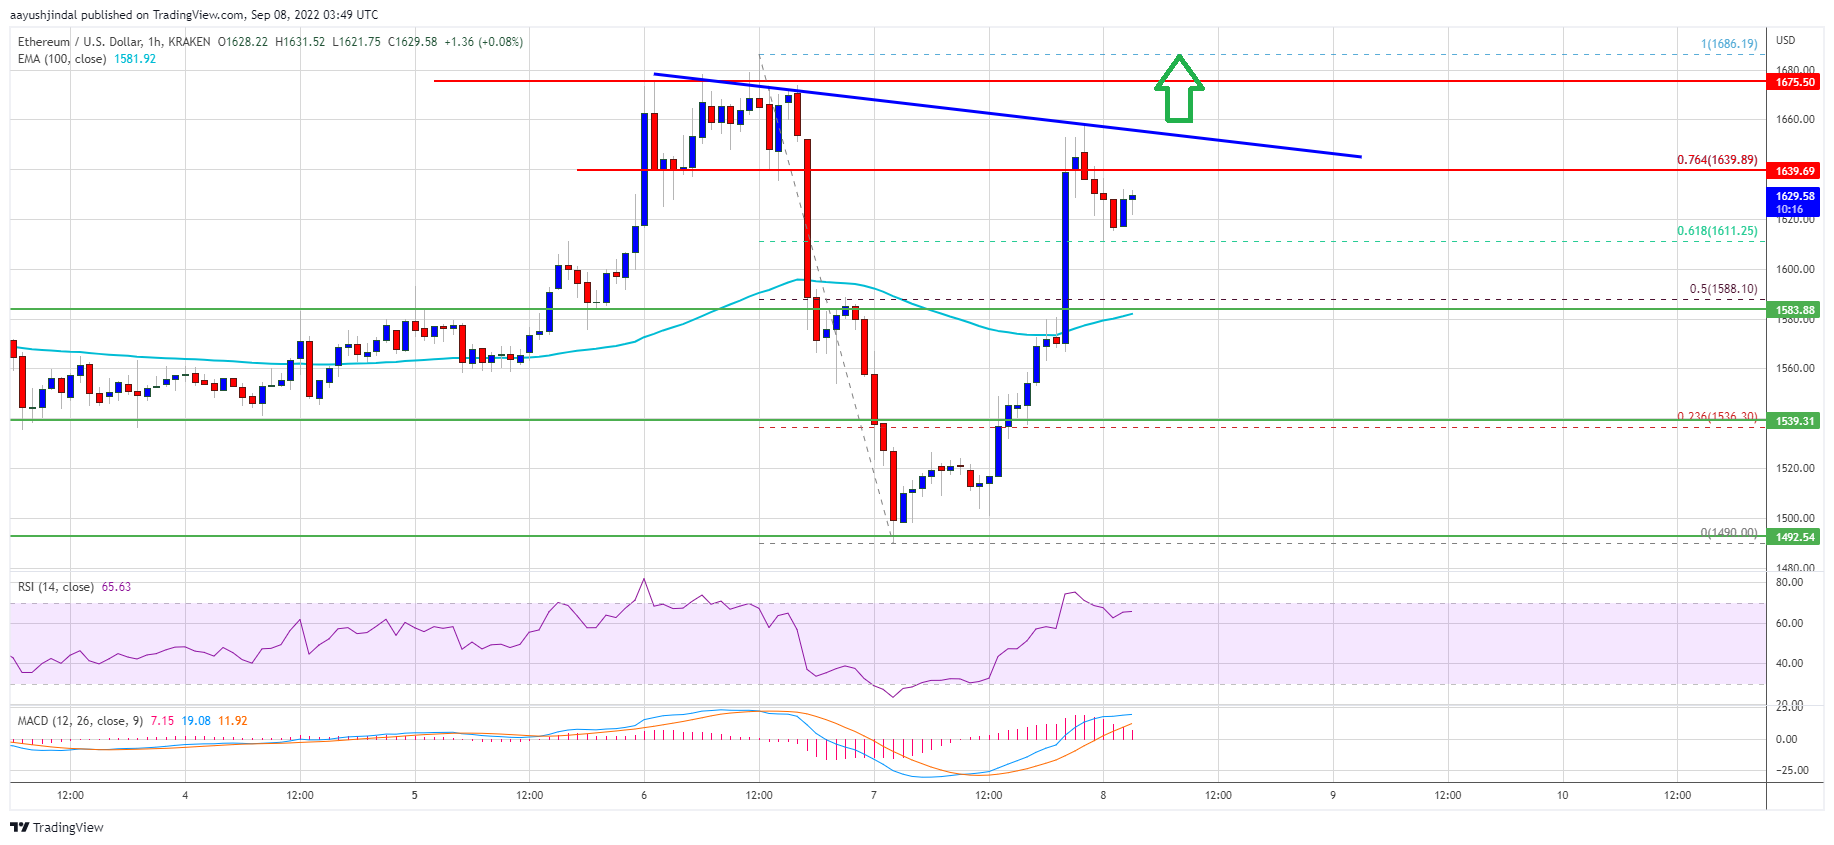
It is now trading above $1,600 and the 100 hourly simple moving average. The price even spiked above the $1,650 level. It is also consolidating near the 76.4% Fib retracement level of the key drop from the $1,685 swing high to $1,490 low.
An immediate resistance on the upside is near the $1,650 level. Besides, there is a key bearish trend line forming with resistance near $1,650 on the hourly chart of ETH/USD.
Source: ETHUSD on TradingView.com
The next major resistance is now forming near the $1,675 level. Any more gains may perhaps open the doors for a move towards the $1,700 resistance in the near term. A clear move above the $1,700 resistance could pump the price towards the $1,800 level.
Fresh Decline in ETH?
If ethereum fails to rise above the $1,650 resistance, it could start a fresh downside correction. An initial support on the downside is near the $1,610 zone.
The next major support is near $1,585 and the 100 hourly simple moving average. A downside break below the $1,585 support might start a sharp decline. In the stated case, ether price might decline towards the $1,540 level.
Technical Indicators
Hourly MACD – The MACD for ETH/USD is now losing momentum in the bullish zone.
Hourly RSI – The RSI for ETH/USD is now above the 50 level.
Major Support Level – $1,585
Major Resistance Level – $1,650


