
Ethereum was able to clear the $1,240 resistance zone against the US Dollar. ETH is showing positive signs and there might be a move above the $1,300 resistance.
- Ethereum is moving higher above the $1,220 and $1,240 resistance levels.
- The price is now trading above $1,220 and the 100 hourly simple moving average.
- There was a break above a key contracting triangle with resistance near $1,215 on the hourly chart of ETH/USD (data feed via Kraken).
- The pair could rise further if there is a clear move above the $1,300 resistance.
Ethereum Price Gains Bullish Momentum
Ethereum price formed a base above the $1,200 level. ETH started a decent increase and was able to clear the $1,220 resistance zone, similar to bitcoin.
There was a break above a key contracting triangle with resistance near $1,215 on the hourly chart of ETH/USD. It opened the doors for a move above the $1,250 resistance zone. The price tested the $1,270 zone and a high is formed near $1,271.
Ether price is now trading above $1,220 and the 100 hourly simple moving average. It is now correcting gains below $1,260. There was a move below the 23.6% Fib retracement level of the recent increase from the $1,204 swing low to $1,271 high.
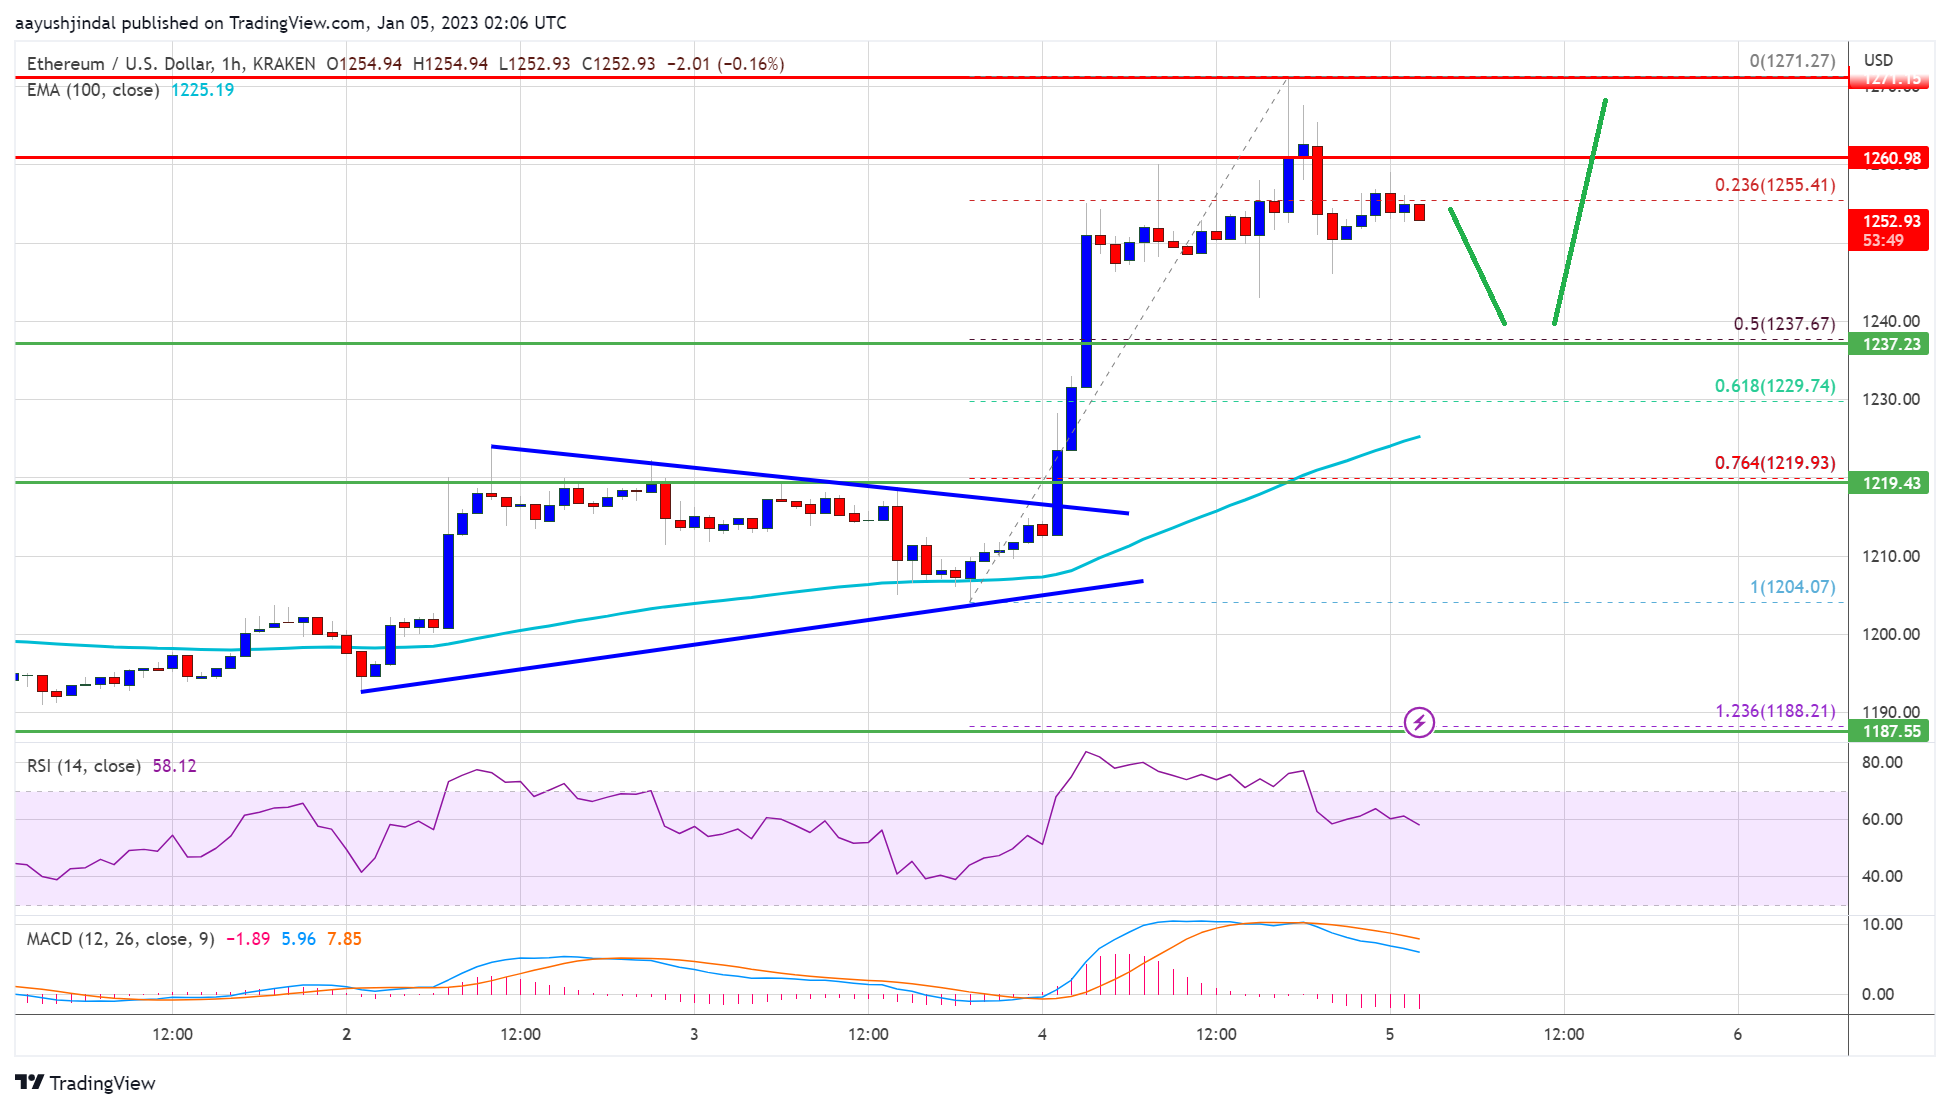
Source: ETHUSD on TradingView.com
An immediate resistance is near the $1,260 level. The next major resistance is near the $1,275 level. A clear move above the $1,275 resistance could another upward move. In the stated case, the price may perhaps rise towards the $1,300 resistance. The next major resistance could be $1,350, above which the price could surge towards the $1,420 resistance zone.
Dips Limited in ETH?
If ethereum fails to clear the $1,275 resistance, it could correct further lower. An initial support on the downside is near the $1,240 level.
The next major support is near the $1,230 level. It is near the 50% Fib retracement level of the recent increase from the $1,204 swing low to $1,271 high. A downside break below $1,230 might send the price towards the $1,220 support. Any more losses might call for a test of the $1,200 zone.
Technical Indicators
Hourly MACD – The MACD for ETH/USD is now losing momentum in the bullish zone.
Hourly RSI – The RSI for ETH/USD is now above the 50 level.
Major Support Level – $1,230
Major Resistance Level – $1,275


I like the helpful info you provide to your articles. I’ll bookmark your blog and test again here regularly. I am quite sure I’ll be informed lots of new stuff right right here! Good luck for the next!